Snapchat growth stops paying at about four posts a week
We tracked 13,444 Snapchat creator accounts for a median of 75 days and matched every subscriber-count change against what those creators actually published. Posting frequency is the only lever that reliably moved an account. It stops working at roughly four Spotlight posts a week, and almost nothing else we tested mattered at all.
By SnapDataHub. Snapchat has no public API for creator data, so we collected these figures ourselves. Every number on this page comes from a query against our own panel.
What we found
- Growth saturates at three to four posts a week. Median subscriber growth climbs from -0.13% per 30 days at zero posts to +1.18% at three to four posts a week. Every step above that is statistically indistinguishable from it.
- Extra posts keep buying views, they just stop buying subscribers. Going from under one post a week to five or six multiplies total weekly views by 8.4. It multiplies subscriber growth by only 3.1.
- Idle accounts bleed, and the biggest bleed fastest. Among accounts that posted nothing and whose count moved at all, 47% of sub-10k accounts declined, against 79% of accounts over 200,000.
- Almost nothing else you can optimise matters. Hashtag count, caption length and day of the week had no measurable effect on views. Video length had almost none. Only using a music track did anything.
How this was measured, and what it cannot tell you
We record subscriber counts for Snapchat creator profiles on a rolling basis. This study uses every profile that had at least two recorded observations more than 30 days apart, held at least 1,000 subscribers at the first observation, and could be matched to its public Spotlight uploads. That is 13,444 accounts observed between 6 May and 30 August 2026.
Growth is expressed as the percentage change in subscribers, normalised to a 30-day rate. Posting frequency counts Spotlight posts uploaded strictly between each account's own first and last observation, so cadence and growth are measured over exactly the same window. We report medians rather than means throughout, because subscriber growth is heavily skewed by a small number of breakout accounts.
These are associations, not proof of cause. Creators who post four times a week differ from creators who post nothing in ways we cannot observe, including whether they are still trying. The honest reading of the headline finding is that the relationship between posting and growth flattens after about four posts a week, not that a specific creator will grow by a specific amount if they post more.
Every limitation we know about is listed in full at the end of this page, including two analyses we ran, believed, and then discarded when we found what was driving them.
1. Growth rises with posting frequency, then stops
The relationship between how often a creator posts and how fast they gain subscribers is strong, monotonic, and short. It runs out at about four posts a week.
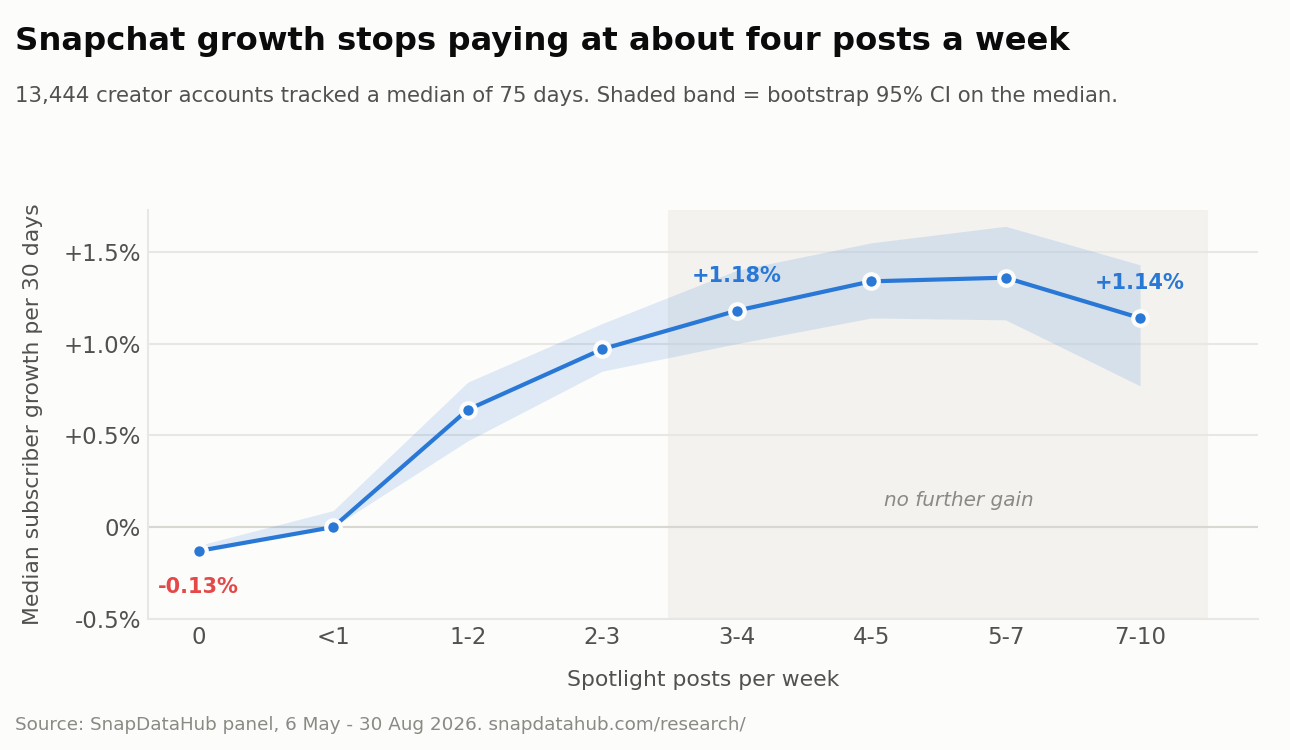
| Posts per week | Accounts | Median growth / 30 days | 95% CI | Grew | Shrank |
|---|---|---|---|---|---|
| 0 (posted nothing) | 4,164 | -0.13% | -0.14 to -0.10 | 26.9% | 54.5% |
| Under 1 | 2,593 | 0.00% | 0.00 to +0.09 | 49.3% | 41.1% |
| 1 to 2 | 1,337 | +0.64% | +0.47 to +0.79 | 63.6% | 31.6% |
| 2 to 3 | 1,436 | +0.97% | +0.85 to +1.11 | 69.8% | 26.7% |
| 3 to 4 | 1,438 | +1.18% | +1.00 to +1.40 | 72.8% | 23.6% |
| 4 to 5 | 1,115 | +1.34% | +1.14 to +1.55 | 76.1% | 20.3% |
| 5 to 7 | 1,096 | +1.36% | +1.13 to +1.64 | 76.2% | 20.9% |
| 7 to 10 | 244 | +1.14% | +0.77 to +1.43 | 76.2% | 18.9% |
The step from one or two posts a week to three or four is real and large. The steps after it are not. We tested each adjacent pair with a Mann-Whitney U test, separately inside each account-size band so that the result cannot be an artefact of larger accounts posting more often:
| Account size | Comparison | Medians | p | Verdict |
|---|---|---|---|---|
| 10k to 50k | 1-2 vs 3-4 / week | +1.01% to +2.15% | 0.0002 | Real gain |
| 10k to 50k | 3-4 vs 4-5 / week | +2.15% to +2.28% | 0.23 | No detectable gain |
| 10k to 50k | 3-4 vs 5-7 / week | +2.15% to +2.04% | 0.77 | No detectable gain |
| 10k to 50k | 5-7 vs 7-10 / week | +2.04% to +1.74% | 0.83 | No detectable gain |
| 50k to 200k | 1-2 vs 3-4 / week | +0.44% to +1.33% | 0.0000005 | Real gain |
| 50k to 200k | 3-4 vs 4-5 / week | +1.33% to +1.39% | 0.85 | No detectable gain |
| 50k to 200k | 3-4 vs 5-7 / week | +1.33% to +1.85% | 0.08 | No detectable gain |
| 50k to 200k | 5-7 vs 7-10 / week | +1.85% to +1.43% | 0.30 | No detectable gain |
| Over 200k | 1-2 vs 3-4 / week | -0.01% to +0.47% | 0.00000002 | Real gain |
| Over 200k | 3-4 vs 4-5 / week | +0.47% to +0.68% | 0.21 | No detectable gain |
| Over 200k | 3-4 vs 5-7 / week | +0.47% to +0.73% | 0.22 | No detectable gain |
| Over 200k | 5-7 vs 7-10 / week | +0.73% to +0.59% | 0.36 | No detectable gain |
In all three size bands the jump to three or four posts a week is significant at p < 0.001. Not one of the nine comparisons above that threshold reaches significance.
2. The extra posts still get watched. They just do not convert.
The obvious explanation for a plateau would be that Snapchat rations reach, so that posting more slices the same audience thinner. We tested that and it is not what happens. Once post age is controlled for, per-post views barely move with posting frequency, and total weekly views keep climbing almost in proportion to how much a creator publishes.
That makes the plateau more interesting rather than less. The views arrive. They stop turning into subscribers.
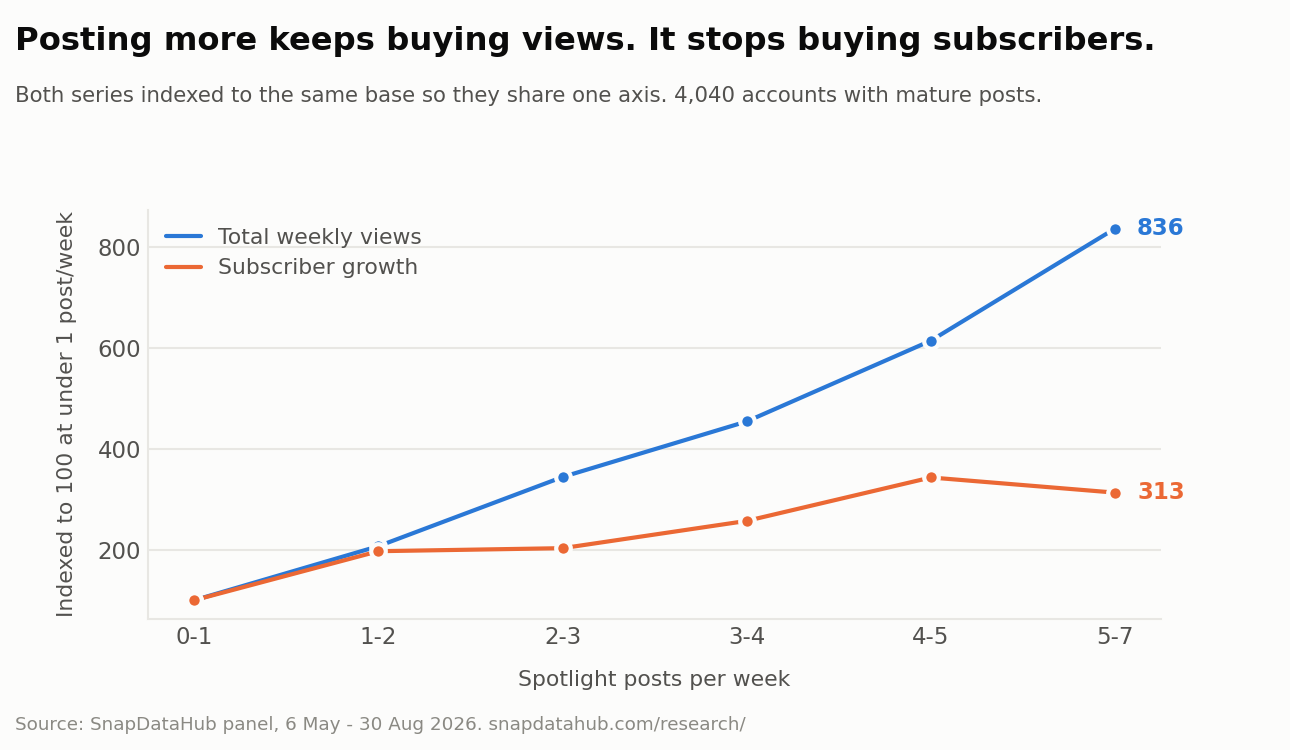
| Posts per week | Accounts | Median views per post | Weekly views (indexed) | Growth (indexed) |
|---|---|---|---|---|
| Under 1 | 614 | 7,682 | 100 | 100 |
| 1 to 2 | 869 | 6,468 | 207 | 197 |
| 2 to 3 | 956 | 5,951 | 344 | 203 |
| 3 to 4 | 762 | 5,783 | 454 | 257 |
| 4 to 5 | 506 | 6,013 | 614 | 343 |
| 5 to 7 | 333 | 6,369 | 836 | 313 |
There is one exception. For accounts above 200,000 subscribers, per-post views do fall as posting frequency rises: doubling cadence costs those accounts 14.7% of their median per-post views (p < 0.001). Below 200,000 subscribers the effect is not distinguishable from zero (10,000 to 50,000 subscribers: -5.3% per doubling, p = 0.09; 50,000 to 200,000: -3.9%, p = 0.17). Whatever is capping large accounts does not appear to apply to smaller ones.
3. Stop posting and the account goes backwards
Snapchat subscriber counts are not a ratchet. Of the 13,444 accounts in the panel, 4,989 finished the window with fewer subscribers than they started with. Concentrate on the accounts that published nothing at all and the pattern is stark, and it gets worse the larger the account is.
One caveat matters here and we have applied it. Snapchat reports subscriber counts to the nearest 100, so a 5,000-subscriber account has to lose dozens of people before the number visibly moves, while a 500,000-subscriber account shows almost any change. Comparing raw shrink rates across sizes would therefore be misleading. The chart below counts only accounts whose number moved at all, which removes that resolution effect. The gradient survives.
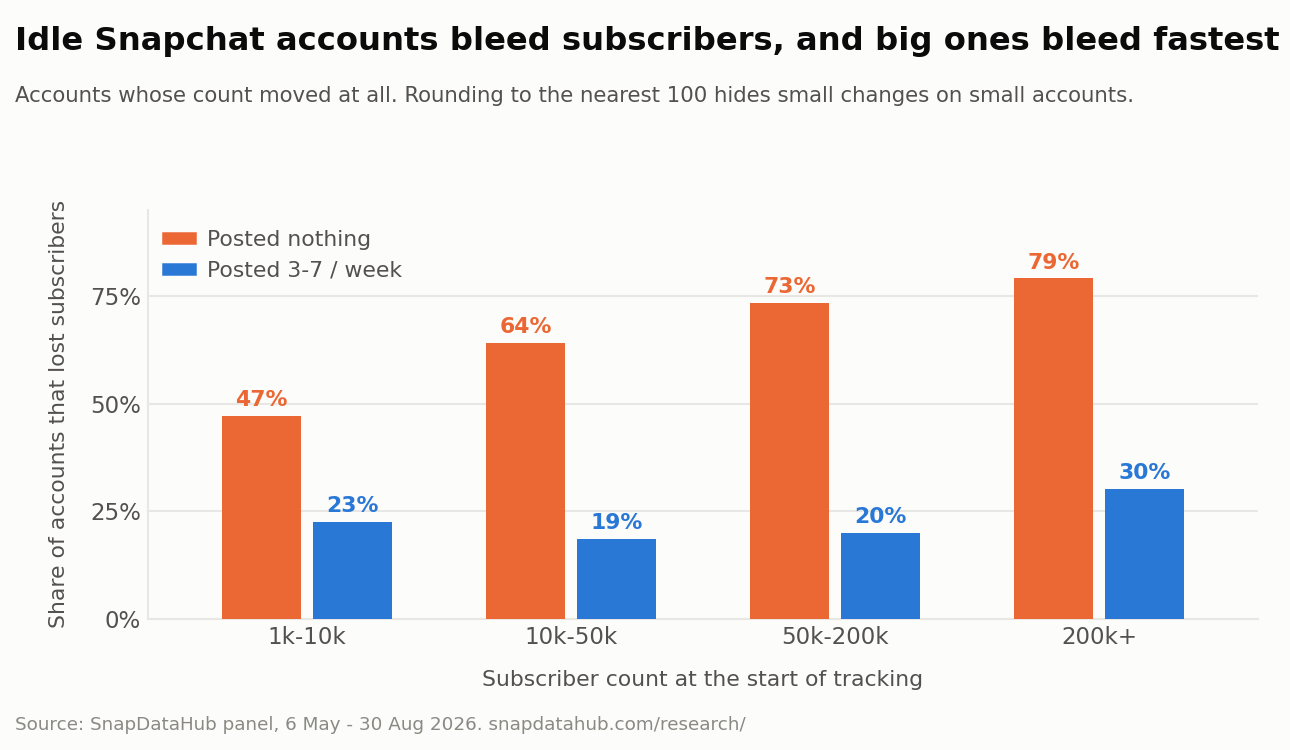
| Subscribers at start | Idle accounts | Count never moved | Declined, of those that moved | Median growth / 30 days |
|---|---|---|---|---|
| 1k to 10k | 807 | 40.9% | 47.2% | 0.00% |
| 10k to 50k | 1,752 | 22.4% | 64.1% | 0.00% |
| 50k to 200k | 1,036 | 4.9% | 73.4% | -0.17% |
| Over 200k | 569 | 0.5% | 79.2% | -0.26% |
Posting neutralises the size penalty almost entirely. Among accounts over 200,000 subscribers, 78.7% of idle ones shrank against 30.2% of those posting three to seven times a week, with median growth of -0.26% and +0.60% per 30 days respectively (Mann-Whitney p < 1e-60). Whatever attrition large accounts are subject to, publishing appears to offset it.
4. The things creators are told to optimise did nothing
For the post-level tests we compared each post against the other posts by the same creator. That removes audience size, niche, follower quality and anything else about the account, because the account is being compared with itself. The sample is 44,008 Spotlight posts from 3,289 accounts, each at least 14 days old when we last saw it.
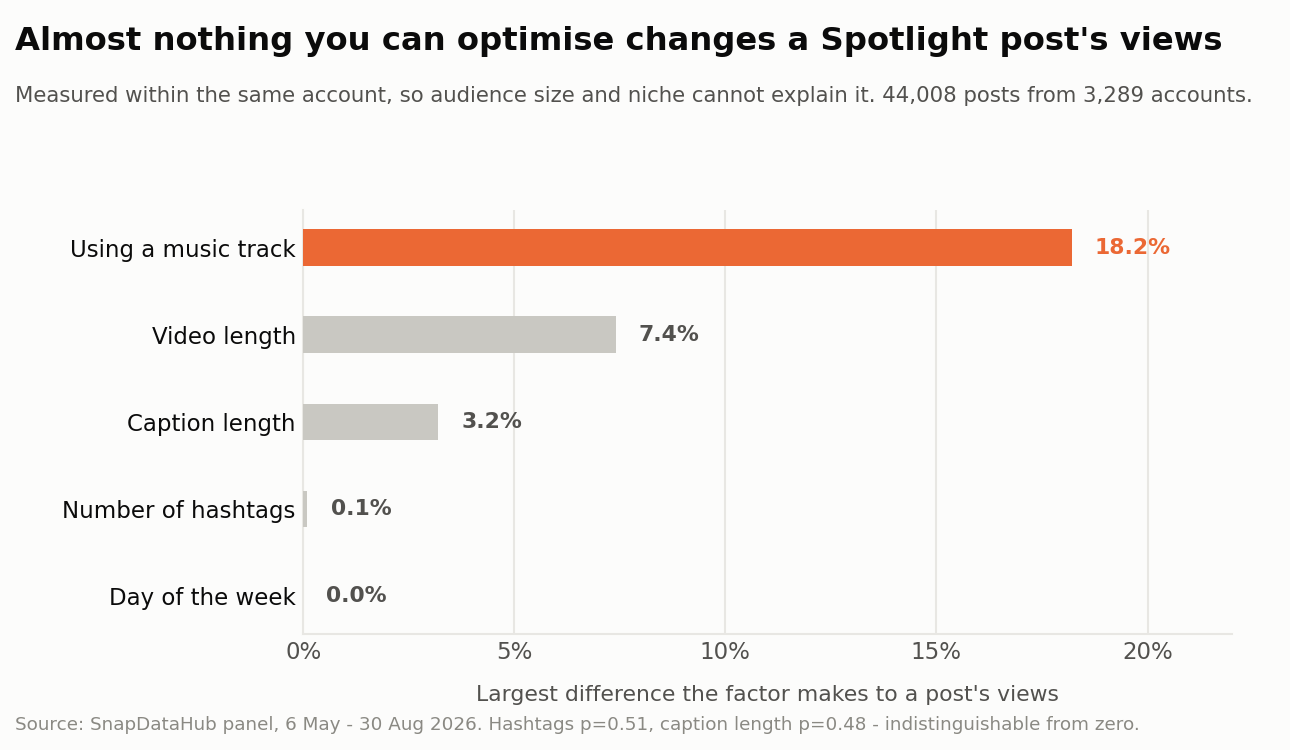
- Hashtags: nothing. Posts with no hashtags and posts with eight or more performed the same. Across six bands the total spread was 0.1 percentage points (Kruskal-Wallis p = 0.51). Snapchat creators spend real effort on this and we can find no return on it.
- Day of the week: nothing. Spread across all seven days was under 0.1 percentage points. The test is technically significant (p = 0.02) only because 44,008 posts will detect an effect far too small to act on.
- Caption length: nothing. Spread 3.2 percentage points, p = 0.48. Note that 38,973 of the posts we measured carry no caption at all.
- Video length: almost nothing. Total spread 7.4 percentage points across every band from under 5 seconds to over 90 seconds, and not in a straight line: 5 to 10 second clips did 2.1% better than their account's median while 45 to 60 second clips did 5.3% worse.
- Music: the one thing that worked. Among the 226 accounts that posted both with and without a music track, posts with music took 18.2% more views than the same creator's posts without (p < 1e-23). Restricting to accounts with at least three of each, the gap widens to 25.5%. This is the only post-level lever in our data that survived the within-account test.
The music result rests on a much smaller base than the others and it remains an association. Creators who reach for a trending track may be putting more effort into the post generally.
Two findings we discarded, and why
Both of these looked like publishable headlines. Both were artefacts. We are including them because anyone running the same queries against a similar dataset will hit them.
"Longer Snapchat videos get more views"
Measured across all posts, this is true: median views rise from 7,064 for clips under 10 seconds to 8,419 for clips over 60 seconds. It is also meaningless. The median account making 60-second clips has 132,000 subscribers; the median account making sub-10-second clips has 98,800. Longer videos are made by bigger accounts. Compare each post against others from the same creator and the entire effect disappears.
| Video length | Posts | Median views (all posts) | Median account size | Effect within the same account |
|---|---|---|---|---|
| Under 10s | 8,404 | 7,064 | 98,800 | +1.5% |
| 10 to 30s | 18,456 | 7,892 | 107,400 | 0.0% |
| 30 to 60s | 7,815 | 7,883 | 117,100 | -0.8% |
| Over 60s | 9,333 | 8,419 | 132,000 | -0.4% |
"Posting more dilutes your reach by 55%"
Our first pass showed median per-post views falling from 5,009 to 2,247 as posting frequency rose, a 55% drop, which would have been a strong and completely wrong story. The cause is post age. A creator publishing seven times a week has posts in our sample with a median age of 6.5 days; a creator publishing once a fortnight has posts with a median age of 25.4 days. Young posts have had less time to accumulate views. Restricting to posts at least 14 days old removes the effect: the true relationship is -5.3% per doubling of cadence, which does not reach significance. This is why every post-level number on this page uses posts that were at least 14 days old when we last observed them.
Limitations
- The window is 3.5 months, not a year. Observations run from 6 May to 30 August 2026. Growth rates here are normalised to 30 days for comparability. They are not annual trends and should not be extrapolated to one.
- We cannot compare across years. Our collection started in May 2026, so the older posts we can still see are disproportionately the ones that survived, which are the hits. Average views by upload year look like a collapse in Snapchat engagement and it is survivorship bias, not a trend. Every analysis on this page is confined to a single collection window for that reason.
- Subscriber counts are reported to the nearest 100. Small changes on small accounts are invisible to us. Where this could distort a comparison, as in finding 3, we report the result among accounts whose count actually moved.
- Our index is partial. We hold 79,741 Snapchat profiles and 1.47 million Spotlight posts. That is not all of Snapchat, and the absence of a creator from our data is not evidence they do not exist.
- Accounts enter the panel non-randomly. Profiles are indexed through public discovery surfaces, so the panel over-represents creators who are visible enough to be discovered. The within-account comparisons in finding 4 are immune to this. The panel-level findings are not.
- Association, not causation. Nothing here is an experiment. Creators choose their posting frequency, and the choice is entangled with motivation, resources and whether the account is still active.
- We did not analyse content. Subject, format, face-on-camera, editing quality and language are all unmeasured, and are plausibly larger drivers than anything we did measure.
- Snapchat Stories are not included. This study covers public Spotlight posts only, which is what is publicly visible. Private Story activity is invisible to us and may well explain some of the subscriber changes we attribute to nothing.
Reuse and citation
The charts and figures on this page are free to republish, including commercially, with attribution to SnapDataHub and a link back to this page. No permission request needed. If you want a cut of the underlying aggregate data for a story, or a chart rebuilt to your house style, write to [email protected] and we will send it.
The aggregate tables behind these figures (CSV, CC BY 4.0, no per-account data) are archived on Zenodo with a DOI: doi.org/10.5281/zenodo.23236450.
Look up any Snapchat creator
Subscriber history, Spotlight view counts, engagement rates and posting cadence for 79,741 public Snapchat profiles.
Search a profile